1.1.15. plot
Implements a cli tool to plot measured data. This tool extracts data from files and plots it as a line graph according to a given specification.
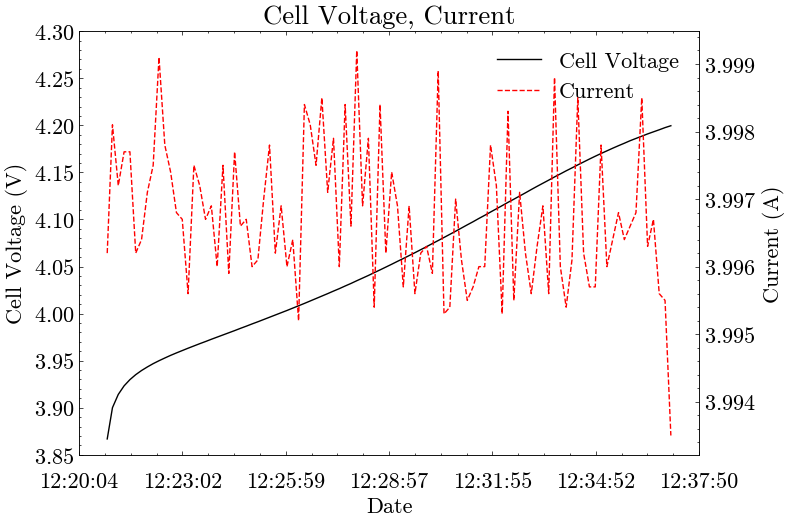
Fig. 1.8 Example Graph - Cell Voltage, Current
1.1.15.1. Usage
Usage: fox.py plot [OPTIONS] INPUT_DATA...

  Generate plots from input data files or directories.

  This command reads input data (for example, CSV using a data configuration
  or PARQUET files) and renders graphs defined in a plot configuration. The
  resulting images are written to the specified output directory or to a
  default location if no output path is given.

Options:
  -p, --plot-config PATH         Path of the configuration file for the plots.
                                 [required]
  -d, --data-config PATH         Path of the configuration file for the data.
  -o, --output PATH              Path of the directory in which the plot-
                                 images will be saved.
  -t, --data-type [CSV|PARQUET]  Type of the data-files to be used as input.
  -h, --help                     Show this message and exit.

  Examples:

      ./fox.sh plot -p config/plots.yml -d config/data.yml data/run1.csv
      ./fox.sh plot -p config/plots.yml -d config/data.yml -t CSV data/
The input-data can contain files and directories. If the data-type has been specified in the command the given files will be processed accordingly and only files with the given data-type will be read from the given directories.
Note
If the input-data contains a directory, the data-type has to be specified.
If no output-directory is specified, a directory by the name
<year-month-day>T<hour_minute_second.millisecond>
is created in foxbms-2/build/plots and set as the output-directory.
For each input-file a directory by the same name will be created in the
output-directory in which the plots will be saved.
1.1.15.2. Configuration Files
Two configuration files are needed to properly extract the data from
csv files and then plot this data.
These files have to be yaml-files and need to have a certain structure to work
with the tool, which will be explained in the following sections.
1.1.15.2.1. Data Configuration File
The data is extracted from the input-files according to the specifications in the data configuration file. Currently only input-files in the csv-format can be read by the tool. For such files the data configuration file needs to have the following structure:
general:skip: Specifies how many lines have to be skipped at the beginning of the file.precision: Specifies the precision of float valuesna_value: Specifies the NaN values of withcsvfile.
columns: List that contains all names of the columns to be extracted from the input-files with the corresponding value-type.
For each column, the following data types are supported: string, float,
int, datetime.
The following shows an example configuration.
general:
  skip: 0
  precision: 4
  na_value: NULL
columns:
  Test Time: datetime
  Step Time(ms): float
  Voltage(V): float
  Current(A): float
Hint
If the input data are in parquet format a data configuration file is
not needed.
1.1.15.2.2. Plot Configuration File
The plot tool can currently only plot lines. Several plots can be created with a plot configuration file and a plot can contain up to three axes.
Note
The plot configuration of the example plot displayed at the beginning is shown below as a reference, with only the Cell Voltage line given for simplicity.
The plot configuration file has to contain one block for each plot, where each block has five main components:
name: The name with which the plot is saved in the end.type: The plot type which must be LINE at the moment.mapping: Block that contains the configuration of each graph.x: Specifies which column for the x-axisx_ticks_count: The amount of ticks to be shown on the x-axis (not required).date_format: Defines the date format as explained here (not required).start_date: Defines the start date in UTC format for the x-axis (not required).time_factor: Defines a factor the x-axis is divided by (not required).start: Defines the start index of the data to be drawn (not required).end: Defines the end index of the data to be drawn (not required).The keys
y1,y2andy3are used for the graphs. Each graph has to contain the following:input: List which specifies the columns from which to take the data.factor: Factor with which the results are multiplied at the end (not required).labels: Labels for each line which will be given in the legend (not required) at the end of this section. (Defaults to the default-type.)min: The minimum value to which the y-axis will be set (not required).max: The maximum value to which the y-axis will be set (not required).
description:title: Title which will be displayed on the plot.x_axis: Label of the x-axisy_axes: List with all labels for the y-axes.
graph:height_px: Specifies the height of the plot in pixels (not required).width_px: Specifies the width of the plot in pixels (not required).dpi: Specifies how many pixels per inch the plot will have (not required).show: Specifies whether the plot will be shown directly after generating it. (Defaults to False.)save: Specifies whether the plot will be saved. (Defaults to False.)format: Specifies the format in which the plot will be saved. (Defaults to png.)
- name: "cell_voltage_current"
  type: "LINE"
  mapping:
    x: Test Time
    x_ticks_count: 7
    date_format: "%H:%M:%S"
    start: 0
    end: -1
    y1:
      input:
        - Voltage(V)
      factor: 1
      min: 3.85
      max: 4.3
      labels:
        - Cell Voltage
    y2:
      input:
        - Current(A)
      labels:
        - Current
  description:
    title: Cell Voltage, Current
    x_axis: Date
    y_axes:
      - Cell Voltage (V)
      - Current (A)
  graph:
    height_px: 550
    width_px: 800
    dpi: 100
    show: false
    save: true
    format: png
1.1.15.3. Example
The following shows how to plot
this data file
using this
data configuration file
and this
plot configuration file.
