1.1.9. gui
The GUI (Graphical User Interface) can be used instead of the command line interface to execute certain tools. Which tools have been implemented in the GUI and how they can be used is described in Section 1.1.9.2.
The output-field at the bottom of the GUI logs the console output of the currently selected tab.
1.1.9.1. Usage
The GUI can be opened via the shortcut gui in the repository root
(gui.lnk - Windows only) or through the command line interface using the
following command:
.\fox.ps1 gui
./fox.sh gui
The GUI is currently not supported on Linux.
Below is the general help text of the gui command, which contains all possible subcommands:
Usage: fox.py gui [OPTIONS]

  Run the graphical user interface.

Options:
  -d, --debug-gui  Debug the GUI (i.e., enable stdout/stderr)
  -v, --verbose    Verbose information.
  -h, --help       Show this message and exit.
1.1.9.2. Tabs
The GUI supports the following tools, which can be accessed via the corresponding tabs at the top.
When running the GUI through the fox CLI package, some tabs are be disabled.
1.1.9.2.1. Build
Note
This Tab is not supported in the fox CLI package.
See also
Further documentation on the Waf tool can be found here.
The Build tab has several components. They are explained in Table 1.12, starting from the top of the Build tab.
Generate a list of all executable commands for the command-field with the
Generate Command Listbutton.Select the desired command from the command-field and execute it via the
Runbutton. Its output will be logged in the output-field and the status of the process is indicated by the status-fields.Optional: Save the current content of the output-field in a file with the
Save Logbutton. The location of this file is printed in the status-text-field.
Component |
Description |
|---|---|
Command-field |
Displays all executable commands. |
Search-field |
Filters the commands in the command-field by inputting the desired command. |
Buttons:
|
Execute various functions, as explained in this part. |
Status-fields |
Indicates the current status through a color and a text field. The status-color is either green if a command was executed successfully, red if an error occurred during execution, or gray. A short status-text is given in the text-field. |
1.1.9.2.2. Bootloader
Attention
Only the load-app command of the bootloader tool can be executed
via the Bootloader tab.
Further documentation on the commands of the bootloader tool can be found
here.
This section only covers the components of the Bootloader tab. Read the Bootloader documentation for a detailed explanation on how this command can be used.
The only components of the Bootloader tab are the Load App button,
which executes the load-app command,
and the Can Bus Configuration frame.
This frame contains drop-down lists in which the Interface,
the Channel, and the Bitrate of the CAN bus must be entered.
These lists contain default values, although custom values can also be defined.
When selecting a default value in the Interface list,
the Channel list will automatically provide matching values.
1.1.9.2.3. Plot
See also
Further documentation on the plot tool can be found here.
The plot tool can be used to create graphs, such as Fig. 1.6, which are referred to as plots in this documentation.
The Plot tab is split into three sub-tabs:
Run Plot: Enter all necessary data to execute the plot tool.
Data Config: Create a
Data Configurationfile.Plot Config: Create a
Plot Configurationfile.
The Plot button can be found in every sub-tab.
It executes the plot tool with the data specified in the
Run Plot tab, regardless of the sub-tab that is currently selected.
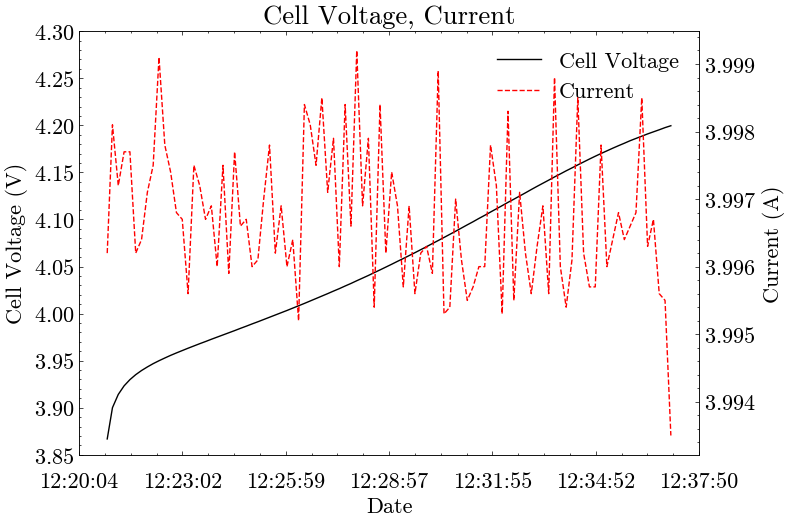
Fig. 1.6 Example Graph - Cell Voltage, Current
1.1.9.2.3.1. Run Plot
The five input fields contained in this tab are explained in Table 1.13.
All paths can be entered manually or chosen via the buttons next to the input fields. After creating a configuration file with either the Data Config or Plot Config sub-tab, its path is automatically added in the corresponding input field.
Name |
Description |
|---|---|
Data Source |
Path of the file containing the data for the plot tool. The file has to be of the type that is given in the Data Type input field. |
Output Directory |
Path of the directory in which the plot-images will be saved. |
Data Type |
Type of the |
Data Configuration |
Path of the configuration file for the data. It can also be created in the Data Config sub-tab. |
Plot Configuration |
Path of the configuration file for the plots. It can also be created in the Plot Config sub-tab. |
1.1.9.2.3.2. Data Config
Attention
All columns needed for plotting have to be specified in the
Data Configuration file with the correct name.
Any spelling-mistakes will lead to errors when running the plot tool.
The path of the Data Configuration file can be specified in the
Data-Config File Path field at the top.
A default value is already provided, but it can be changed if needed.
The Generate Data Configuration button at the bottom creates the file and
enters its path in the Data Configuration field on the Run Plot
sub-tab.
The file is only created if the creation-process finishes without errors,
and any error messages are displayed in the output-field.
All relevant information for the configuration file has to be entered in the Data Configuration frame in the middle, as explained in Table 1.14.
Name |
Description |
|---|---|
Number of Lines to skip |
Specify how many lines have to be skipped
at the beginning of the |
Precision of Data |
Specify the precision of float values. |
Input Columns |
Enter all columns that have to be extracted
from the The field that contains The value-type of the column can be chosen from the drop-down list next to it. The A column can be removed via the
|
1.1.9.2.3.3. Plot Config
A Plot Configuration file can contain several plots,
with each plot containing up to three lines.
Every plot requires an input column for the x-axis
and every line requires an input column for its y-axis.
Attention
Only columns that are specified in the Data Configuration file
can be used as input columns.
The path of the Plot Configuration file can be specified in the
Plot-Config File Path field at the top.
A default value is already provided, but it can be changed if needed.
The Generate Plot Configuration button on the right creates the file
and enters its path in the Plot Configuration field on the Run Plot
sub-tab.
The file is only created if the creation-process finishes without errors,
and any error messages are displayed in the output-field.
Adding items to the configuration file displays their name in the box on the right, showing the structure of the plots and lines.
All data for a plot has to be entered in the Plot Data frame,
as explained in Table 1.15,
and can then be added via the Add Plot button.
One plot has to contain at least one line.
Each line has to be added through the Line Data frame.
Add a line to a plot by entering all necessary data,
as specified in Table 1.16, selecting the name of the plot
in the box, and pressing the Add Line button.
Any added item can be selected from the box on the right and removed via
the Remove Selected Item or opened with the Open Selected Item button.
When an item is open, all of its information is displayed in the
corresponding fields, allowing the user to change it.
The changes are saved by adding the item again.
However, this only works if it has been removed beforehand.
Name |
Description |
|---|---|
Plot-File Name |
Name of the plot that will be used as the file name if it is saved. It has to be unique for each plot. |
Plot Type |
Select the type of the plot from the drop-down list. |
Plot Title |
Title of the plot that will be displayed. |
Input Column x-Axis |
Name of the Input Column from the |
Label for x-Axis |
Label for the x-axis of the plot that will be displayed. |
Labels for y-Axes |
All labels for the y-axes in the plot. If the plot contains more than one y-axis, a label must be specified for each of the y-axes, separated by commas. Pay attention to the order of the labels. The first label is assigned to the y-axis, which was added first. |
Save Plot |
Specify whether the plot should be saved. The default value is No. |
Show Plot |
Specify whether the plot should be shown during plotting. The default value is No. |
Name |
Description |
|---|---|
Input Column y-Axis |
Name of the Input Column from the |
Optional: Label for the Line |
Label for the line displayed in the plot. If no value is specified, the label of the corresponding y-axis is used. |
Optional: min y-value |
Set the bottom limit of the y-axis to this value. |
Optional: max y-value |
Set the top limit of the y-axis to this value. |
1.1.9.2.4. Embedded Unit Tests
Note
This Tab is not supported in the fox CLI package.
This tab is not yet implemented.
1.1.9.2.5. fox CLI Unit Tests
Note
This Tab is not supported in the fox CLI package.
See also
Further documentation on the cli-unittest tool can be found here.
This tab is not yet implemented.
1.1.9.2.6. Run Program/Script
See also
Further documentation on these tools can be found here for run-program and here for run-script.
This tab is not yet implemented.
